

Lean in Human Resources with data management and its impacts
 |
“I am convinced that nothing we do is more important than hiring and developing people. At the end of the day you bet on people, not on strategies.” - Lawrence Bossidy |
In this blog article, I will explain how data management in Human Resources (HR) is crucial if you want to put in place an efficient HR policies, to hire people, to understand why your employees are leaving… Collecting data is your FIRST ACTION to understand your current situation, to be aware of your problems, to solve them, to reach Excellence and reduce your costs.
To write this content, my personal experience as Continuous Improvement Expert for one automotive industry in Poland will be used.
When I started to work for the HR department, I was faced with real disorganization in term of data management. After a small observation in their office and questions to the team’s members (Kaizen principles), several issues appeared:
- No standard about data collections on internal files (everyone had his/her own rules)
- No standard for almost all internal reporting (the same report changed every months in term of format, formulas…)
- Losses of times to retrieve “standard” reports because people did not know how to properly use Excel
With this context, the HR manager asked for my collaboration to help her team with data management and improve her department. I used my knowledges of Lean and data management to perform several actions:
To achieve that, my source was the existing data and some of them were compiled with a database in Access that I designed. As support for analysis, I built Excel templates with macros (VBA) to speed-up the process and to reliable results.
Lockers for operators
Few days after my arrival, one of the employees explained to me that she had an issue to control lockers. Regarding the business’ standard, each employee in production, when he/she arrives, he/she has 2 chests (one in the kitchen and one in the dressing room). Furthermore, we didn’t know exactly how many lockers were available for new workers. As well, her manager requested a visual template to check the current status for closets.
To accomplish that, I did a 5S. With the HR specialist (the owner of the process), our first action was to perform a deep inventory of lockers in the canteen and in the dressing rooms (man and woman). When we were counting them, we tried to found the lockers’ owner. On the same time, we were drawing the layout about lockers’ disposal within rooms. This draft was used to create visual cards to guide people in the building.
When this picture was taken, we set in order our data collected (one excel sheet per room). Moreover, we checked that each locker was owned by people from production. For each mistake revealed, we investigated before taking some actions. Then, we shined the Excel file (by creating a standard) before incorporating data within the database. For each locker, a clear code was created:
- The evidence number (matricula for each employee) for lockers owned by workers
- The code 99999 for external people
- The code 00000 for empty closets
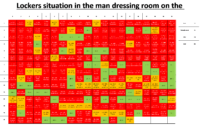 When data were integrated, I used them to shape the automatized report requested by the HR manager. For this dashboard, each cells had the locker’s number, the matricula and the employee’s name. Moreover, visual tips were used to facilitate the reading:
- Red for lockers owned by employees
- Orange for external people
- Green for empty lockers
With this automatized template, standardized for each room, it was easy to process it, to investigate lockers owned by external workers, to be aware of free closets and to take decisions for buying new ones.
Density and age structure analysis
With the database that I constituted, I dealt with some key elements to draft the HR policy with the department’s manager. Those inputs are: the date of birth, the date of employment, the sex, the category (direct, indirect, administrative) and the job. From them, two dispatches were founded: the age structure and the density analysis.
The age structure
The pyramid or age structure is very useful to determine your human risk. It is the combination of two records: age of people and sex.
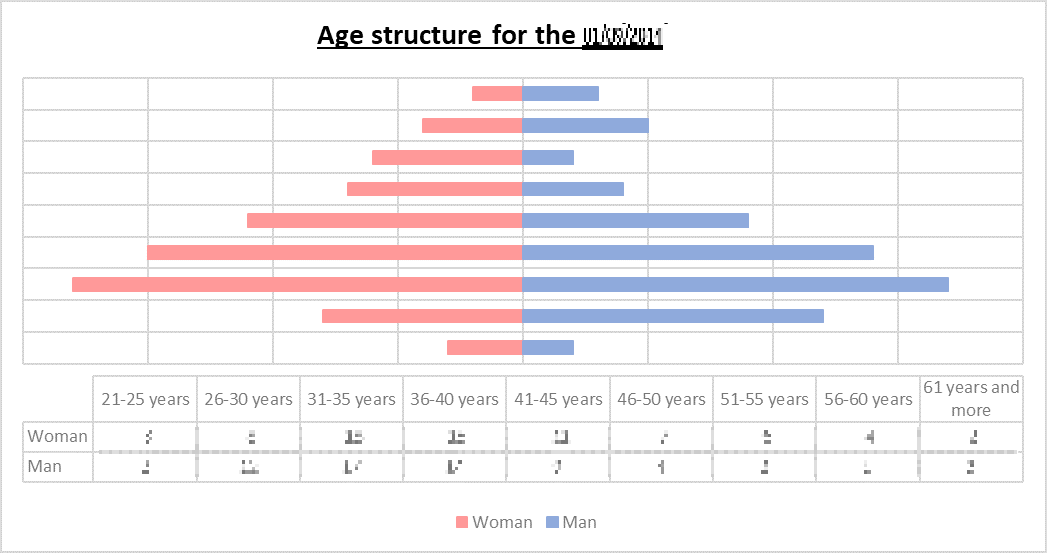 With this analysis, you can observe if:
- Your repartition between men and women are almost equal
- You have too much “old” people which might indicate you that you need to prepare to hire new people and think how you want to transmit your knowledge and culture
- You have too much “young” people which might show that you do not manage to retain talented people or you are focusing on low costs
- You have a lot of women between 25 - 40 years old means that you have a risk to have maternity leaves and to find new people for those periods
But this report is not enough to establish your recruitment policy, you need to release the density analysis.
The density analysis
This analysis is the combination of two data: age of people and the anciency within the company. But several criteria (the department, the job’s category, …) has to be taken in consideration if you want deepest analysis and affine your policy.
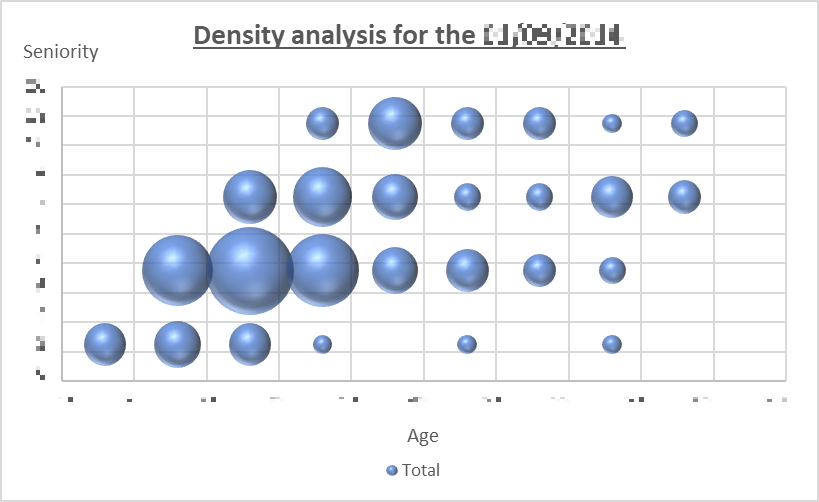 With this dashboard, for example, you can see if:
- You have a lot experienced employees who know the company culture (to prevent the retirement leave)
- Few events impacted the business (the financial crisis in 2008-2009 for example)
- Your people are staying in the business (with few people with less than 2 years within the business for example)
- Some department might have internal crisis (a high turnover for example)
With this report, you start to have a clear picture about your social situation and your potential risks that your company might be facing off.