A good tool to visualize data to perform Lean actions: Power BI

A good tool to visualize data to perform Lean actions: Power BI

Sep 13, 2019 Blog by Matthieu LEGER
Share
“The goal is to turn data into information, and information into insight.” - Carly Fiorina, former CEO of Hewlett-Packard Co.

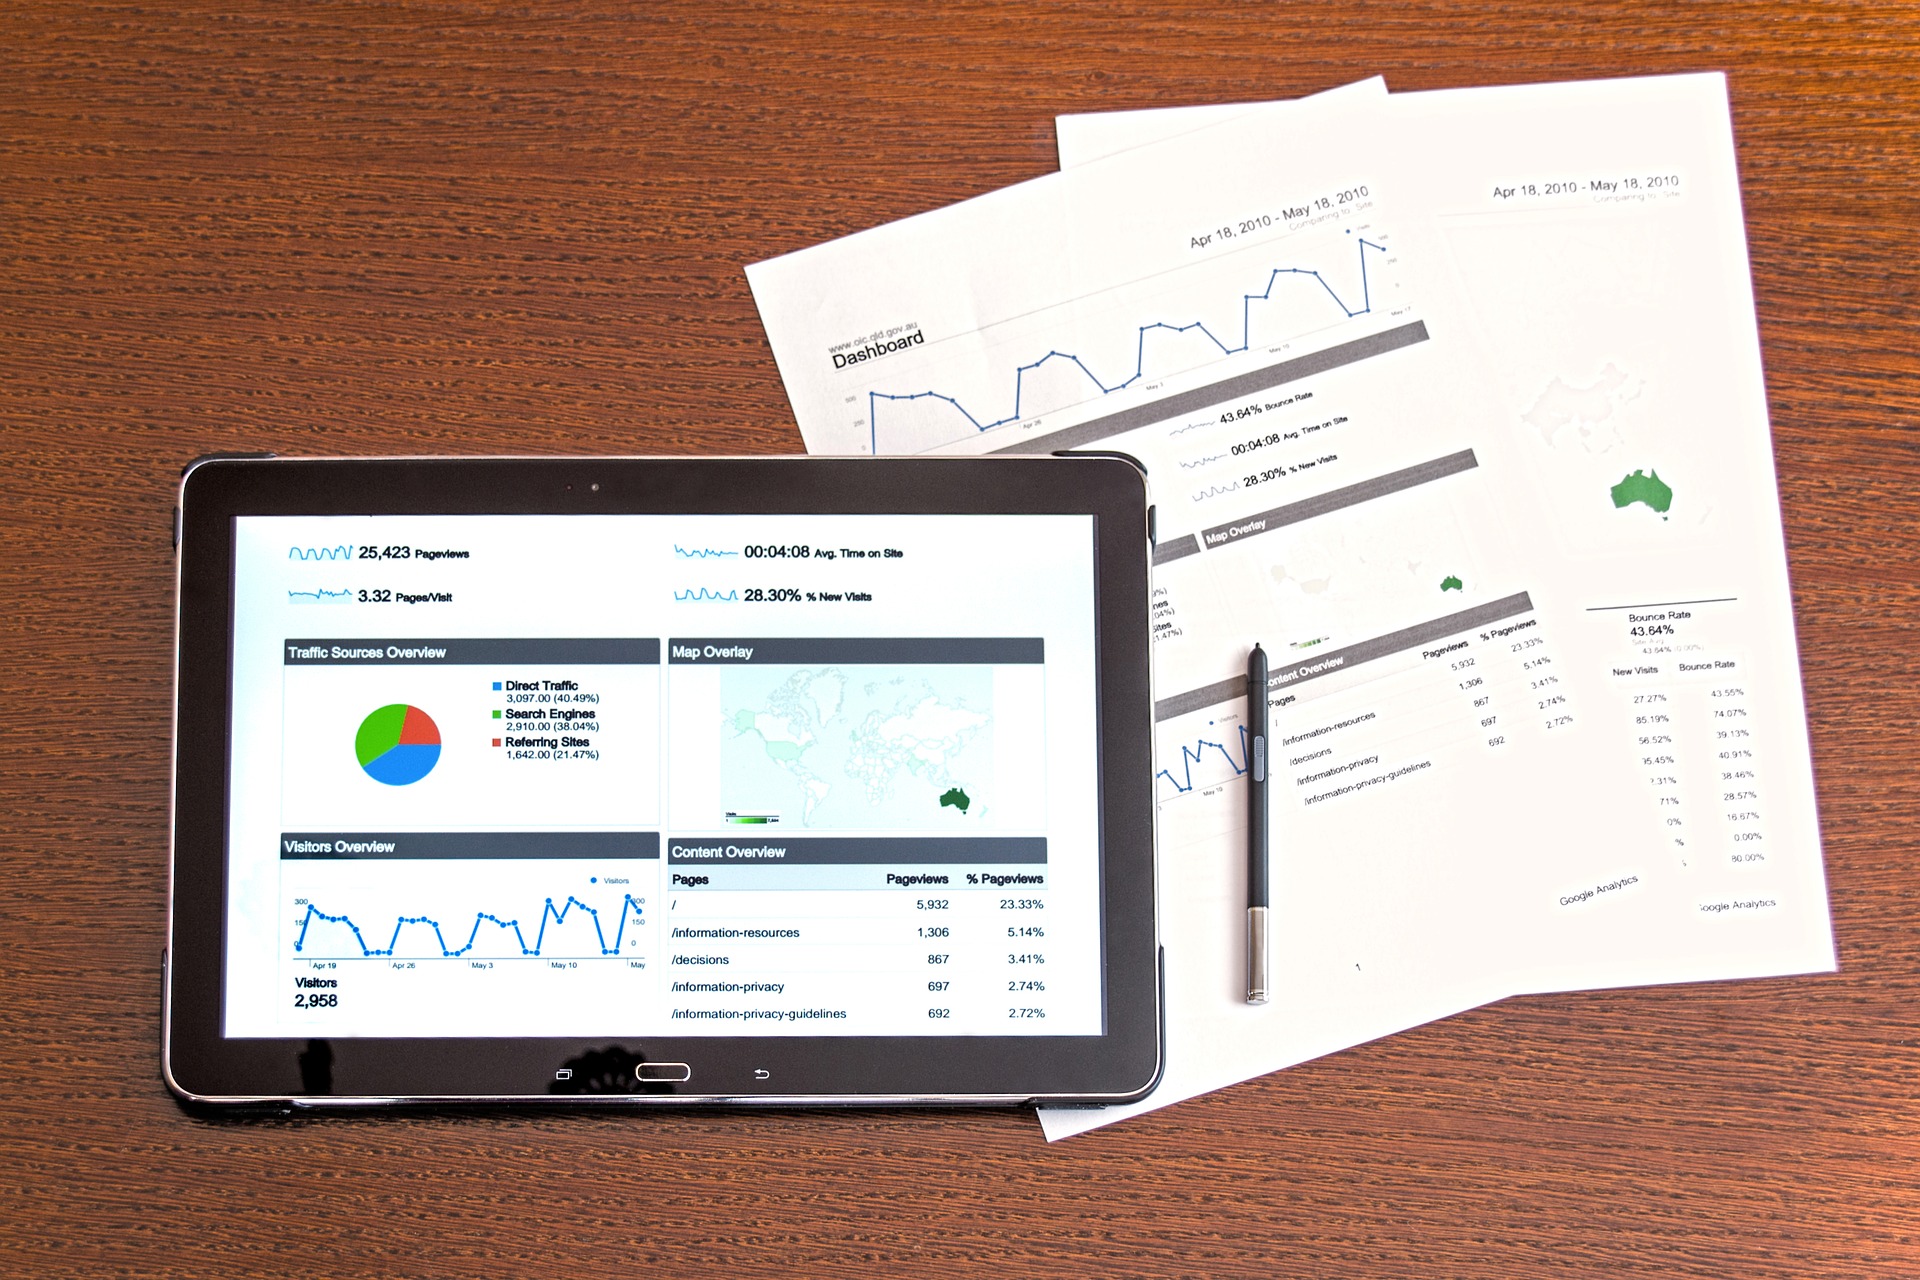
Today, there are several tools which might support you to visualize your data for decisions making. About that, everybody is thinking about Excel which is correct. But recently, Microsoft developed a free and powerful tool to analyze your data: Power BI Desktop. Drive your information into insight by improving your data processing is crucial to perform Lean actions and improvements within your business.

Within this article, I will present three advantages and inconveniences for using Power BI for your data analysis to reach Excellence.

Advantages for using Power BI

When I started my journey with Power BI, the three main advantages that I discovered for using it are:

  • Analyze data from all kind of sources / bases
  • Use graphs to visualize data
  • Inquiry your analysis.
Analyze data from all kind of sources / base

First of all, before analyzing your data, you have to get them. With Power BI, you can collect data from all kind of sources: Excel, Access, Oracle, MySQL, SAP,…. It is the first advantage of using Power BI.

To collect them, when you are into Power BI, you have to go on Get Data -> Select your source (or more). Then, a new window will open where you can select tables that you want to analyze. When your data are downloaded, you can link your tables together to facilitate your data combination and to start your analysis with visualizations.

Use graphs to visualize data

This is the second advantage of using Power BI. When I am speaking of visualization, I am thinking about graphs. This tool proposes a large range of charts to model your data. Among all representations (situated on the right side), you can use:
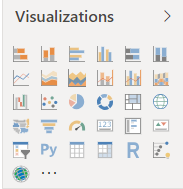
  • Diagram
  • Histogram
  • Pie Chart
  • Scatter chart
  • Funnel
  • Gauge
  • Maps

All of these options will help you to present your data to make the best decisions and reach Excellence. As well, your visualizations will help others to understand data, your mind, your message and go deeper to analysis.

Enquiry your analysis

Inquiry your data and charts is the third advantage by using Power BI. In fact, when your report is ready, you can analyze some specific data by clicking on graphs or filtering your page, file,… These options are very useful to highlight some specific items. When you are selecting items on the report, it will show its impact on other designs by highlighting them. With this method, you might be able to investigate what is going wrong within your business and perform some corrective actions.

But, when I started to use Power BI, I discovered three inconveniences which might discourage your people to use it.

Inconveniences for using Power BI

In this second part, I will present three issues linked to Power BI which can constitute a brake for users:

  • Difficulties to go through very specific items
  • Programming and modifying queries
  • Memory’s consumption.
Difficulties to go through very specific items

Once, with Power BI, on a cost analysis, I would like to focus on items not allocated. But, I couldn’t see which lines, items and invoices were impacted. It started to become one inconvenient for me. To solve this bottom neck, in parallel, I am using Excel to affine my analysis. For people, it might be disturbing to use both tools.

Programming and modifying queries

The second inconvenient for using Power BI is that you have to know how to program and modify queries. In fact, to retrieve your data (even if you build your report), a query is running within your report. But times to times, your data source is not correct or there are several issues in it. When those issues occur, it means that you have to modify your queries. To perform this action, you have to go on Edit Queries. Then, select your table that you want to modify and click on Advanced Editor. A new window will open. Within, you can modify your queries like name and type of the fields, add new actions in your query…

When you do not know something about this tool or how to modify a query, one place can help you to achieve this mission: internet. Here, there is a lot of sources where you can learn how to modify a query including the Power BI Microsoft website. If you want to improve yourself, you have to learn by yourself and practicing because you are not sure to have a specialist of this tool within your company.

Memory’s consumption

The third inconvenient with Power BI is when your file is heavy and contains thousands of data. In fact, too many MegaBytes (MB) might generate troubles. Power BI will consume a lot of memories and CPU on your computer / laptop. Consequence, your machine can slow down and Power BI might crash. To avoid this kind of issues, you can reduce the size of data uploaded by modifying your queries. As well, on your computer, you need to close all the applications that you do not use. With those two tips, you will free some space on your disc and reduce the crash's risk.

To conclude, do not forget one thing: „A business is a range of data that you have to analyze if you want to move forward and make the best decision”. Analyzing your data with Power BI or with another tool is the FIRST ACTION to launch the process of continuous improvement. It will be as well your tool of control (dashboard) for all actions put in place.

If you want concrete examples of automatized reporting with Power BI or you would like some support within your business to build report with this tool, please, feel free to contact our consultant or to give your feedback below.

Leave a Reply

Your email address will not be published. Required fields are marked *

error: Content is protected !!

By continuing to use the site, you agree to the use of cookies. More

The cookie settings on this site are set to "accept cookies" to provide you with the best possible browsing experience. If you continue to use this site without changing your cookie settings or click on "Accept" below, you consent to this.

Close