
Webpage performance with Google Analytics: one Lean action
 |
“No great marketing decisions have ever been made on qualitative data.” - John Sculley |
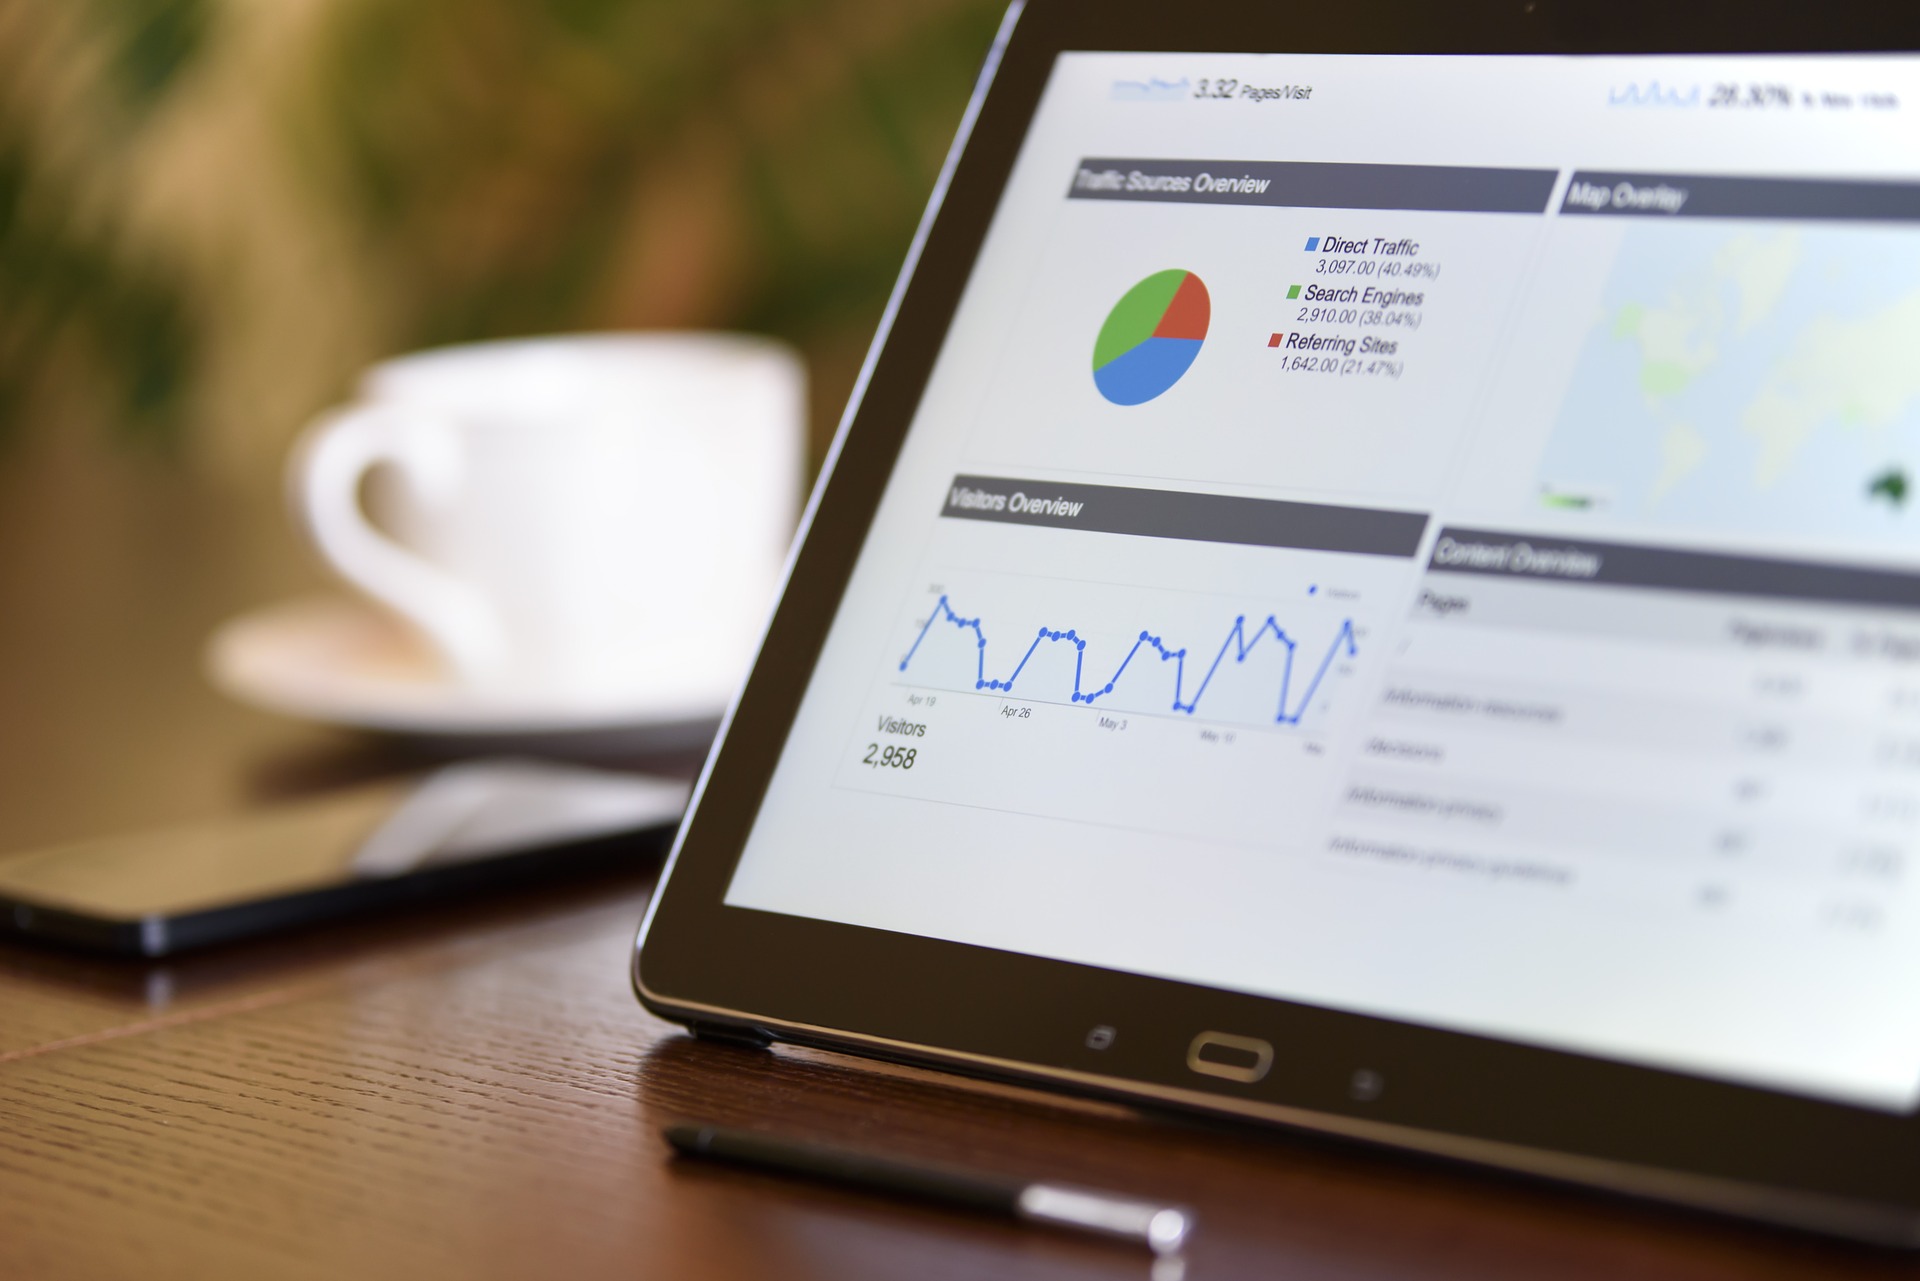
Today, every business are online with a webpage. There are several tools which help you to measure your performance and reach Excellence. The main one is Google Analytics. It corresponds to two types of Lean actions: improve your data processing and visual management.
Key elements to understand your traffic on your webpage
Users
Users are the number of people visiting your website. Furthermore, Google is telling you the growth rate and how you are improving in term of number of visitors. To go deeper, Google Analytics shows you if these users are new or not.
Sessions
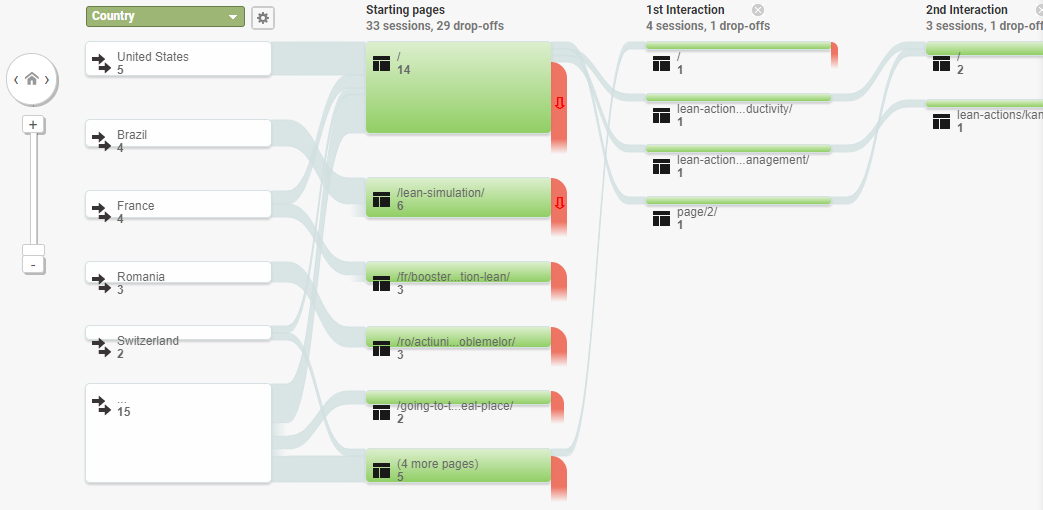 Sessions is the number of pages that people visited on your website. Google is telling you the growth rate and how are you improving in term of visited pages. Moreover, Google Analytics proposes you a deeper analysis like your visitor’s journey (see on the picture on the left). It helps you to understand where people are going and what they are looking for. To have this kind of analysis, you have to go on Reports -> Audience -> Users Flow .
The bounce rate
The Bounce Rate is the percentage of visitors leaving your webpage after arriving on your website. More this rate is high, more your website is not efficient. By consequence, when this rate is not good, you have to review your content/design because people do not find easily what they are looking for.
The session duration
The session duration is the average time that a user is spending on your website. When this indicator is high, it means that you manage to retain people and they are reading your content and find your content interesting. Then you have to convince this audience to buy your products/services.
Geographic and Demographic
Those two variables are important to know about your customers. With geographic, you will have data about where your people are coming from (country and city) with key data (users, new users, number of sessions, average time spent on your website…). With demographic, you will know what is the age, sex and point of interest of your user. With this data, it will be easy to target your public, retargeting them and understand their points of interests.
Technology and devices
Those two variables are essential because it will determine if your users are going through computer, laptop, tablet or mobile and which browser they are using. Your website has to be mobile-friendly because a lot of people are surfing on the net via these equipment. Moreover, your pages have to be adaptable to all browsers. If your site is not mobile-friendly or has compatibility issues, you will lose your user forever. In fact, you have only one chance to make first impression.
Keywords
Keywords are sentences that your audience is using to reach your website. It has a direct impact with your SEO (Search Engine Organic). Those keywords have to be long to facilitate your website research. They have to be both on your title, meta and content, to help Google to rank you. With Google Search Console, you can see your position by viewing keywords and queries that your audience is using. To improve your keywords research and increase your website’s reach, you can use Google Keywords Planner or Google Trends.